- +1 800 433 4609
- |
- Request Info
Physical and Mental Stress Zones
Green Zone Readings
The Balanced Autonomic Nervous System - A healthy Stress balancing system
Green zone readouts. Represent individuals with a good balance between the sympathetic and parasympathetic components of the ANS, who respond well to challenge and have good stress reserves. The scattergram shows good dispersion of activity and the histogram is centrally located and normally distributed. It also represents a picture of good health, since a balanced ANS generally means a system that is regulating well. These respondents are more able to move in either direction to process a mental or physical challenge with a return to a balanced system more quickly after a challenge than someone with a non-balanced ANS. A person functioning well in business is one who has green zone readout with a slight sympathetic dominance. An example of this sort of readout is shown below.
1)
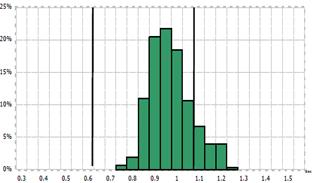
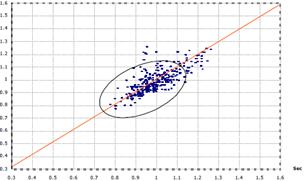
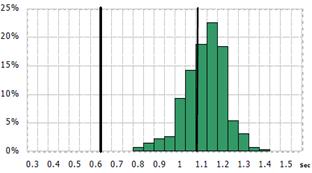
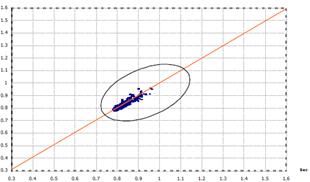
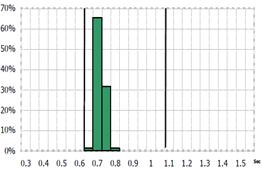
Measure of distribution of your heart rate. Deviation to the left shows tachycardia or fast heart rate; to the right shows bradycardia or slow heart rate. Central location (normocardia) is normal heart rate.
Measure of degree and direction of change in your HRV. The oval represents the normal change. Points clumped together indicate little HRV and presence of stress. Points outside the oval indicate excessive HRV that has several possible causes.
Comment
Note the central position of the histogram, its relative bell-shape and the reasonable spread of points within the oval of the scattergram. These patterns indicate a normal autonomic nervous system balance.
2)
Measure of distribution of your heart rate. Deviation to the left shows tachycardia or fast heart rate; to the right shows bradycardia or slow heart rate. Central location (normocardia) is normal heart rate.
Measure of degree and direction of change in your HRV. The oval represents the normal change. Points clumped together indicate little HRV and presence of stress. Points outside the oval indicate excessive HRV that has several possible causes.
Comment
A good example of a normal reading. Note the patterns as discussed previously indicative of good autonomic balance.
Yellow Zone Readouts
The following examples are of overall yellow zone readouts.
These represent the next level of deviation away from the healthy HRV and more extensive autonomic imbalance.
This happens when there is current stress on the body's regulatory mechanisms and does not necessarily imply a bad profile, but possibly current strain. This will show as a yellow zone reading with either an increase in both sympathetic and parasympathetic nervous system activity or a parasympathetic predominance. It is seen as an increased total power in the analysis representing increased nervous system activity. If this occurs in conjunction with a rise in sympathetic activity it is normal and healthy and may only represent a temporary reaction to mental and/or physical challenge. A persistently overactive autonomic nervous system due to unrelenting challenge can lead to either of the two scenarios above and exhaustion of reserves. These individuals need to relax more and take more recreation in order to achieve more balance. An overactive ANS can often be seen in athletes, in which case it does not necessarily represent an abnormality. An example of this sort of readout is shown below.
3)
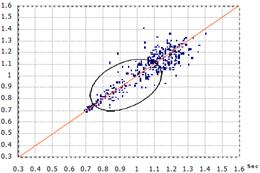
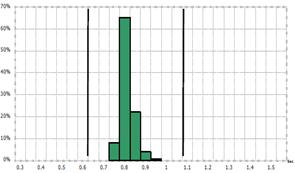
Measure of distribution of your heart rate. Deviation to the left shows tachycardia or fast heart rate; to the right shows bradycardia or slow heart rate. Central location (normocardia) is normal heart rate.
Measure of degree and direction of change in your HRV. The oval represents the normal change. Points clumped together indicate little HRV and presence of stress. Points outside the oval indicate excessive HRV that has several possible causes.
Comment
Here we see the opposite spectrum where the autonomic imbalance is due to parasympathetic predominance. Notice the broad scattergram with less height and also the more diffuse spread of points on the scattergram. This is mild parasympathetic predominance.This is due to activation of parasympathetic reserves to deal with a challenge. This could be a temporary affair as the histogram is fairly central. This situation can occur due to having a cold or due to menses in a woman.It could also be due to fatigue or excessive physical demand.
4)
Measure of distribution of your heart rate. Deviation to the left shows tachycardia or fast heart rate; to the right shows bradycardia or slow heart rate. Central location (normocardia) is normal heart rate.
Measure of degree and direction of change in your HRV. The oval represents the normal change. Points clumped together indicate little HRV and presence of stress. Points outside the oval indicate excessive HRV that has several possible causes.
Comment
Note that although the histogram is central, that the scattergram shows a clustering of points and that the histogram also shows the same lack of variation in HRV .The overall imbalance here is in favour of sympathetic nervous system predominance.
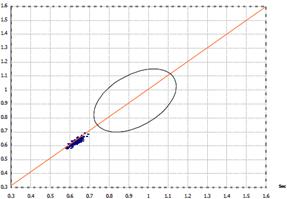
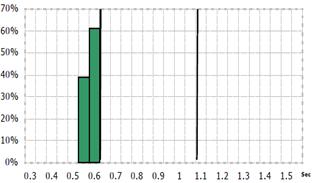
5)
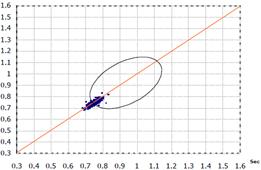
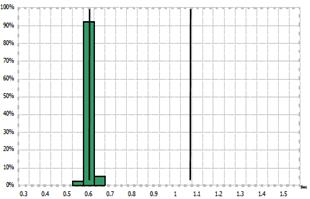
Measure of distribution of your heart rate. Deviation to the left shows tachycardia or fast heart rate; to the right shows bradycardia or slow heart rate. Central location (normocardia) is normal heart rate.
Measure of degree and direction of change in your HRV. The oval represents the normal change. Points clumped together indicate little HRV and presence of stress. Points outside the oval indicate excessive HRV that has several possible causes.
Comment
Note the clear sympathetic nervous system predominance here with the tall narrow leftward-displaced histogram. The scattergram confirms the trend with clustered points and again leftward displacement due to the associated relatively fast heart rate. This situation is synonymous with a relative exhaustion of parasympathetic reserves leading to a sympathetic dominance particularly in the presence of reduced total power.
Physical Strain/Exhaustion Readouts
There are certain HRV patterns that indicate an active strain on parasympathetic reserves.
This pattern is often seen in physical overstrain (as in over training in athletes or fitness fanatics), current illness e.g. flu, menstruation in women, fatigue or anxiety. The questionnaire section should help to clarify which of these, if any, apply.
The typical pattern is one showing an excessive HRV, often with scatter of points outside the oval on the scattergram and a broad-based histogram confirming excess parasympathetic nervous system activity.
6)
Measure of distribution of your heart rate. Deviation to the left shows tachycardia or fast heart rate; to the right shows bradycardia or slow heart rate. Central location (normocardia) is normal heart rate.
Measure of degree and direction of change in your HRV. The oval represents the normal change. Points clumped together indicate little HRV and presence of stress. Points outside the oval indicate excessive HRV that has several possible causes.
Comment
Excess variation in the histogram and scattergram. This is parasympathetic predominance with rightward movement of both histogram and scattergram due to bradycardia. This may represent a temporary situation of facing a physical challenge such as current illness or menstruation in a woman etc. The only way to be sure is to repeat the reading when the client is well again.
7)
Also indicates chronically stressed reserves and a reduction in the efficiency of action of parasympathetic nervous system compensatory activity. It can also be caused by retention of anger. This will be shown as either a red zone reading or a yellow zone reading, depending on the degree of compromise of reserves. It is also observed as a reduction in variation on the scattergram and histogram, but less markedly so than in the exhausted state described above. Research has shown that in this state there is also increased vulnerability to cardiac and other illnesses. It is the profile seen in someone who is chronically stressed or chronically anxious. Again, these are individuals who are more vulnerable to burnout and measures should be taken to target resources to them.
Measure of distribution of your heart rate. Deviation to the left shows tachycardia or fast heart rate; to the right shows bradycardia or slow heart rate. Central location (normocardia) is normal heart rate.
Measure of degree and direction of change in your HRV. The oval represents the normal change. Points clumped together indicate little HRV and presence of stress. Points outside the oval indicate excessive HRV that has several possible causes.
Comment
Excess variation in the histogram and scattergram. This is parasympathetic predominance with rightward movement of both histogram and scattergram due to bradycardia. This may represent a temporary situation of facing a physical challenge such as current illness or menstruation in a woman etc. The only way to be sure is to repeat the reading when the client is well again.
Red Zone Readouts
The following examples are of overall red zone readouts.
These represent the most significant level of deviation away from the balanced HRV and more extensive autonomic imbalance with exhaustion of reserves. In our experience the health of clients in this zone is at risk and they all have been encouraged to have a health screen as well as make any necessary lifestyle changes.
Means that the autonomic nervous system is not responding well to challenges, usually because of exhaustion of reserves after having to meet chronic stress on the body's balancing mechanisms. It is seen as a red zone readout, with markedly reduced variation on the scattergram and histogram. These individuals are vulnerable to the effects of stress and are the ones most likely to get sick, physically or mentally. They will suffer burnout if measures are not taken to address negative lifestyle issues and stress and anger coping strategies.
8)
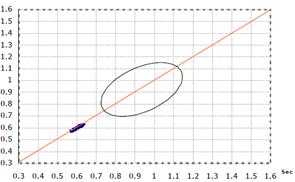
Measure of distribution of your heart rate. Deviation to the left shows tachycardia or fast heart rate; to the right shows bradycardia or slow heart rate. Central location (normocardia) is normal heart rate.
Measure of degree and direction of change in your HRV. The oval represents the normal change. Points clumped together indicate little HRV and presence of stress. Points outside the oval indicate excessive HRV that has several possible causes.
Comment
Ninety percent of data occurring within a very narrow range of variability and points on the scattergram are clustered together confirming very low HRV. This as a stable rhythm i.e. when there is very little HRV. Notice also the tachycardia evident by the leftward shift on both charts, consistent with sympathetic dominance.
9)
Measure of distribution of your heart rate. Deviation to the left shows tachycardia or fast heart rate; to the right shows bradycardia or slow heart rate. Central location (normocardia) is normal heart rate.
Measure of degree and direction of change in your HRV. The oval represents the normal change. Points clumped together indicate little HRV and presence of stress. Points outside the oval indicate excessive HRV that has several possible causes.
Comment
Another example of sympathetic dominance with reduced compensatory parasympathetic reserves with reduced HRV.