- +1 800 433 4609
- |
- Request Info
Heart Rate Variability Analysis
Heart rate variability (HRV) is a measure of variations in the heart rate. It is usually calculated by analyzing the time series of beat-to-beat intervals from ECG or arterial pressure tracings.
Various measures of heart rate variability have been proposed, which can roughly be subdivided into time domain, frequency domain and non-linear measures. HRV is regarded as an indicator of the activity of autonomic regulation of circulatory function. It also regarded as the definitive method of analyzing the activity of the autonomic nervous system. Alteration (mostly reduction) of HRV has been reported to be associated with various pathologic conditions like hypertension, hemorrhagic shock, and septic shock. It has found its role as a predictor of mortality after an acute myocardial infarction.
TIME DOMAIN
A simple example of a time domain measure is the calculation of the standard deviation of beat-to-beat intervals. Other time domain measures include root mean square of the differences between heart beats (rMSSD), NN50 or the number of normal to normal complexes that fall within 50 milliseconds, and pNN50 or the percentage of total number beats that fall with 50 milliseconds. SDNN has been strongly corelated to overall variability, while rMSSD relates to the parasympathetic nervous system activity on heart rate.
FREQUENCY DOMAIN
A common frequency domain method is the application of the discrete Fourier transform also known as the Fast Fourier transform, to the beat-to-beat interval time series. That expresses the amount of variation for different frequencies. Several frequency bands of interest have been defined in humans.
High Frequency band (HF) between 0.15 and 0.4 Hz. HF is driven by respiration and appears to derive mainly from vagal activity or the parasympathetic nervous system.
Low Frequency band (LF) between 0.04 and 0.15 Hz. LF derives from sympathetic activity and has been hypothesized to reflect the delay in the baroreceptor loop. This delay is attributed to the sympathetic systems use of a second messenger system known as the cyclic AMP (cAMP) system.
Very Low Frequency band (VLF) band between 0.0033 and 0.04 Hz. The origin of VLF is not well known, but it had been attributed to thermal regulation of the body's internal systems..
In the last few years HRV acquired an extreme popularity in almost all branches of contemporary medicine, including in the area of prevention. One of the creators of this new trend is Prof. Dr. Svetoslav Danev, who proved that the unfavorable changes in HRV could be used as a predictor of wide range of life-threatening diseases, including carcinosis (the extensive spread of cancer throughout the body). This was determined in the course of a long-year cohort research and monitoring.
Since HRV reflects most directly the balance in the two branches of the Autonomic nervous system - sympathic and parasympathic (vagus), this triggered the creation of a new important bio-constant - the so called vegetative equilibrium. It has a wide application not only in the prevention, but also in other branches of medicine.
From a mathematical perspective, HRV reflects the regularity of the heart beat activity - increased regularity corresponds to decreased heart rate variability, and vice versa. The heart rate variability is derived from the difference in time intervals elapsed between two consecutive heartbeats, called cardiointervals (R-R intervals) and measured in milliseconds (ms). The cardiointervals are received from the ECG signal, as it is demonstrated on the figure bellow.
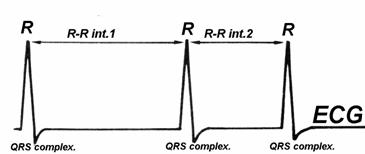
ECG is electrocardiogram, the QRS complexes correspond to heartbeats, and R-R 1 and R-R 2 are cardiointervals.
The increased sympathicus activity (tone) results in a decreased HRV, and vice versa - the increased parasympathicus activity increases the HRV.
Statistically important correlation has been discovered between the HRV parameters and other basic clinical and paraclinical investigations and researches. This proved the existence of an important relation between the results obtained by VitalScan and certain clinical, laboratory, physiological, and psychological examinations. VitalScan, however, has the advantage of higher informativeness and easier practical application and execution.
HRV does not reflect the exact diagnosis, but rather the nonspecific anterior health risk in percentage (prior to the development of the disease process), since HRV measures the qualitative/numerical levels of stress and training, both of which are major risk factors. Chronically increased levels of health risk (for a time period longer than few months) can result in progress of serious diseases. Many scientific research papers and reports have been published on the topic of the reliability of HRV application in different branches of medicine - as described in the "HRV IN DIFFERENT MEDICAL AREAS" section.